Solid state hard drives are the new craze – and for good reason too. They offer a linear access speed regardless of where the data is located on the drive, a improved MTBF (Mean Time Between Failure) and have a lightening fast access/seek time. We are looking at using SSD drives for our new servers and I wondered how reliable they were compared to normal hard drives. For example, would a single SSD drive be more reliable that 2 SATA hard drives in RAID 1? The answer is a definite “no” and by a long shot.
Hourly Reliability
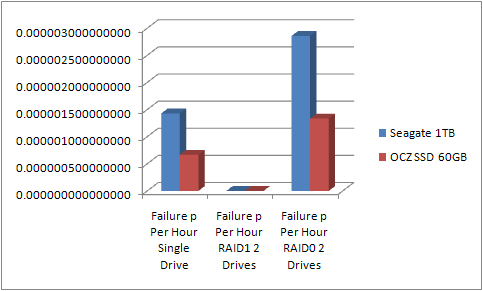
I did a few calculations and plotted two different graphs. The first one is the probabilities of failure within the same hour. It can be assumed that 2 drives dieing in the same hour in a RAID1 array would destory the array.
Daily Reliability
The next graph shows the probability of a drive failing in a 24 hour period.

RAID 1 Failure
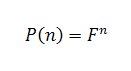
It really shows how well RAID1 is against drive failure. 1 SSD versus 2 SATA in RAID1 is no where near as reliable. The reason why there is such a massive difference is that for a RAID1 drive to fail, both drives have to fail within the period of bringing up a replacement drive. In other words, drive 1 and drive 2 need to fail. To calculate this, we bring the probability of a single drive failing to the exponent of the number of drives in the RAID1 array.
RAID 0 Failure
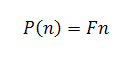
It is interesting to see that the SSD’s in RAID0 have a failure rate less than a single SATA drive. The extra speed gained by SSD’s in RAID0 is quite a small cost in terms of reliability. To calculate the probability of a RAID0 failing it is simply if drive 1 or drive 2 fails.